
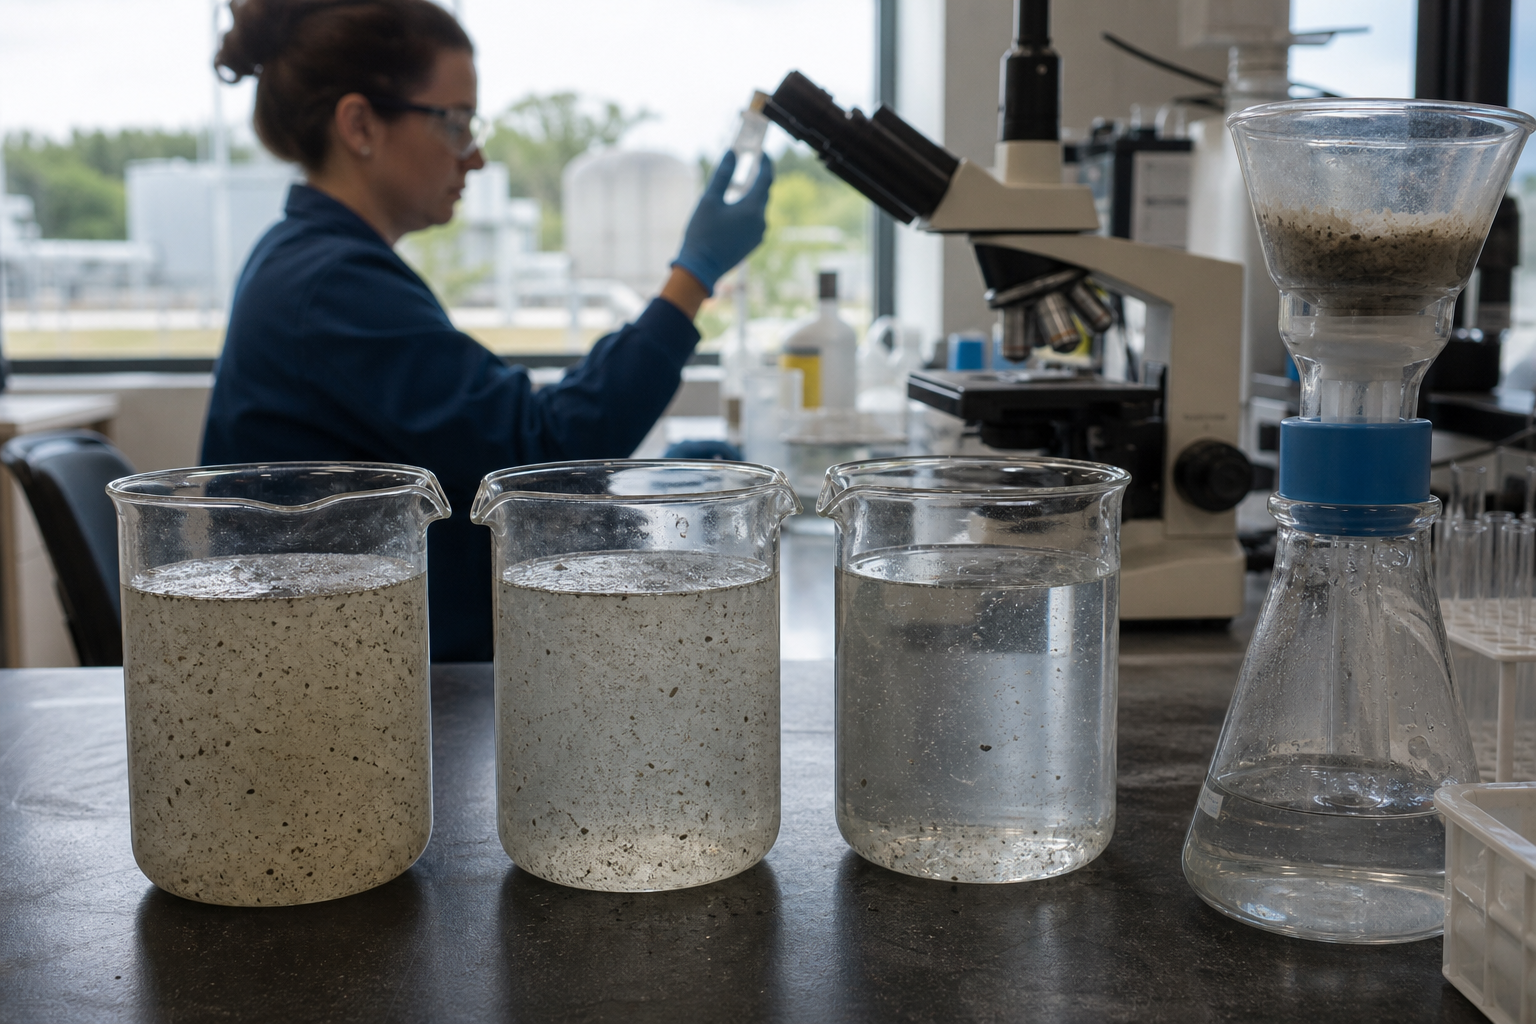
Removing Microplastics with Coagulation
Coagulation can remove microplastics, but the result depends on polymer type, particle size and shape, surface condition, pH, salts, NOM and the coagulant–flocculant sequence. PAC supplies hydrolyzed aluminum species and sweep flocculation; cationic PAM adds charge patching and bridging; PFS can work but is not automatically equivalent; chitosan adds adsorption and charge neutralization with pH and solubility limits. Treat published percentages as bounded jar-test evidence.
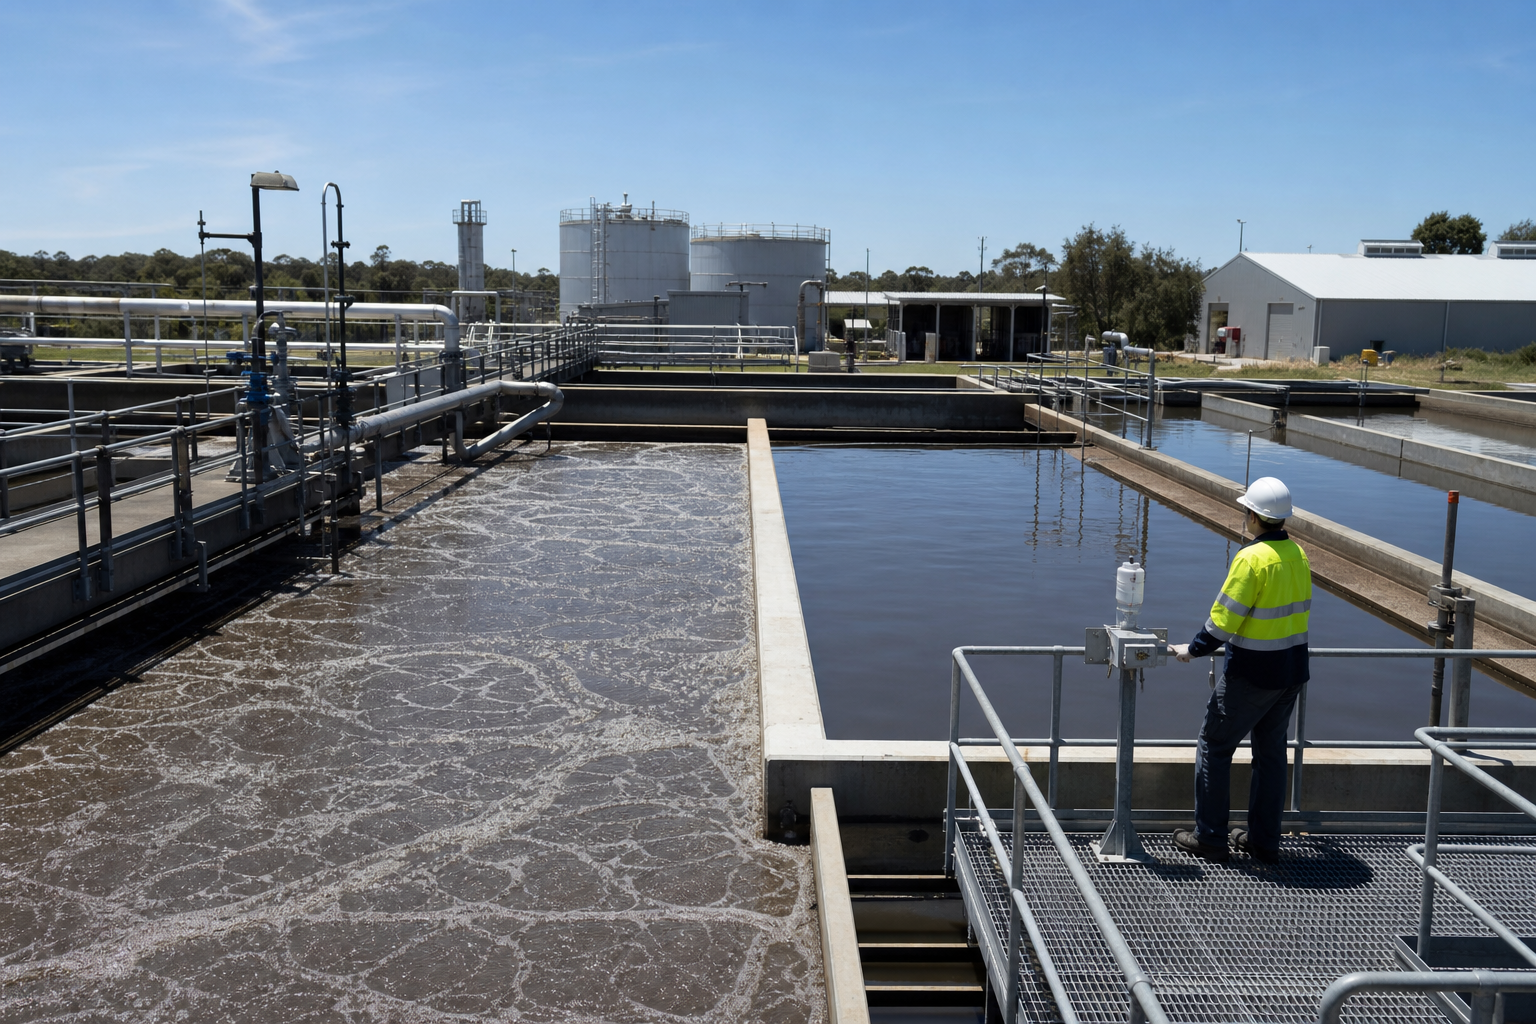
Can coagulation remove microplastics?
Yes, especially when particles are large enough to be swept into settleable flocs and the water chemistry lets the coagulant destabilize their surface. But “microplastics” covers fibers, films, fragments and beads made from PE, PP, PET, PVC, PS and other polymers. Density, weathering, biofilm, surfactant coating and organic matter can change whether a particle collides with and stays in a floc.
The right commercial question is not “which chemical removes microplastics?” It is “which coagulant–aid sequence removes our measured particle population without creating an unacceptable sludge, residual or downstream filtration burden?”
Mechanisms: charge neutralization, adsorption, bridging and sweep flocculation
| Mechanism | What happens | Chemistry that may contribute | Boundary |
|---|---|---|---|
| Charge neutralization | Hydrolyzed Al or Fe species and cationic polymer reduce repulsion so particles collide. | PAC, PFS, ferric salts, cationic PAM, protonated chitosan. | Overdose can reverse charge and restabilize particles; measure zeta/charge or residual turbidity. |
| Adsorption | Plastic surface, NOM and coagulant hydroxide phases associate and become part of the floc. | PAC, chitosan and metal hydroxide flocs. | Weathering, surfactants and NOM can occupy sites or change hydrophobicity. |
| Polymer bridging | Long polymer chains attach to more than one particle or to a particle and mineral floc. | Cationic or suitable PAM; chitosan in some matrices. | Mixing, molecular weight, charge density and order of addition determine whether bridges form or shear apart. |
| Sweep flocculation | A larger hydroxide precipitate physically enmeshes particles as it settles. | PAC, PFS, ferric and alum at the right pH/dose. | Sludge volume and capture vary with solids, alkalinity, pH and settling conditions. |
PAC vs PFS for microplastic coagulation
| Option | Strength | Evidence boundary | What to test |
|---|---|---|---|
| PAC + cationic PAM | Aluminum hydrolysis plus charge patching and bridging; strong candidate when the particle surface and pH support it. | A 2026 study reported 87.5 ± 3.53% PS removal at 300 mg/L PAC + 10 mg/L cationic PAM, pH 7, with different values at other pH levels. | PAC basicity, Al dose, PAM charge/MW, mixing and residual Al. |
| PFS + cationic PAM | Ferric hydrolysis and dense floc; may suit waters where iron chemistry and sludge handling are acceptable. | A review reports 62.5% PS removal for PFS/cationic PAM in the cited comparison; not a universal performance value. | Fe residual, color, pH, sulfate, sludge and particle-size distribution. |
| PAC + chitosan | Metal hydroxide sweep plus biodegradable polymer adsorption/charge effects. | A PET study reported removal close to 90% in tap water under its normal dosage; the particle, water and dose were specific to that study. | Chitosan solubility, acid preparation, pH, molecular weight, dose and sludge dewatering. |
PAC is not automatically better than PFS in every water. Current literature includes both PAC-favoring comparisons and studies where PFS performed strongly. The decisive variables are particle population, matrix, pH, coagulant dose, aid charge, mixing and separation—not the product acronym alone.
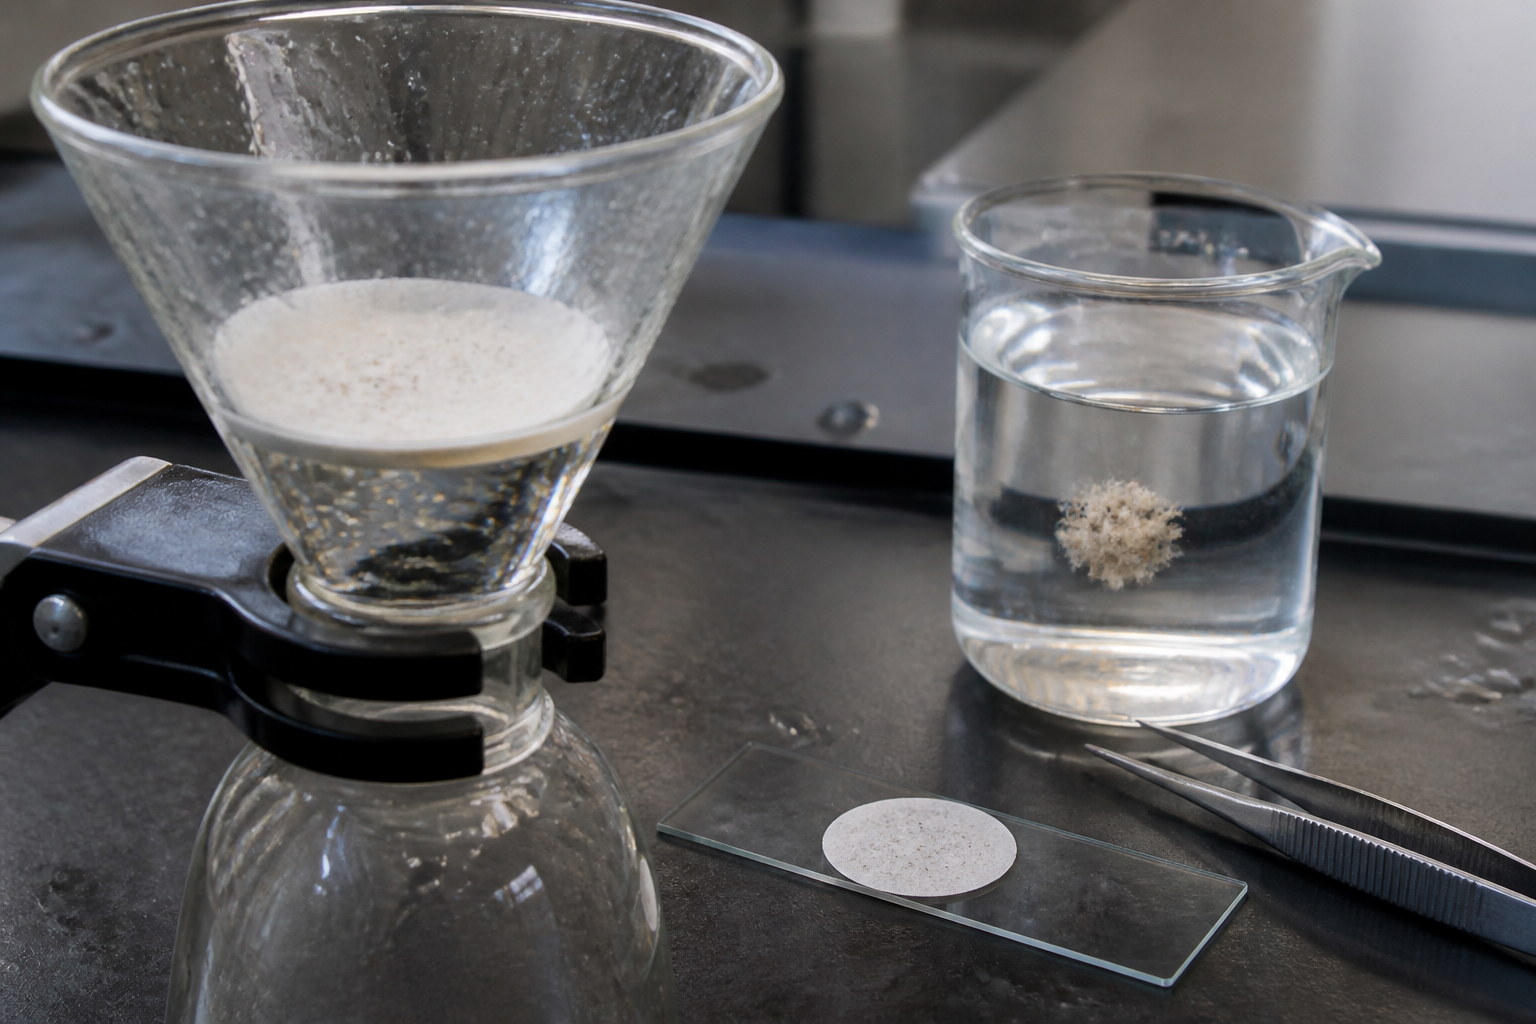
Evidence ladder: PAC alone → PAC + PAM → PAC + chitosan
| Stage | Published example | How to interpret it |
|---|---|---|
| PAC alone | In the 2026 wastewater study, PS removal peaked at 33.75 ± 1.77% at pH 7. | Useful baseline for that PS suspension and test method, not a universal PAC efficiency. |
| PAC + cationic PAM | At 300 mg/L PAC + 10 mg/L cationic PAM and pH 7, PS removal reached 87.5 ± 3.53% in the same study. | Shows the effect of bridging/charge interaction under defined conditions; confirm residual polymer and sludge quality. |
| PAC + chitosan | A 2023 PET study reported close to 90% removal in tap water and nearly threefold improvement versus PAC in its normal-dose comparison. | Different particle and study; do not merge its result with the PS/PAM experiment as if it were one dose-response curve. |
How particle and water properties change the result
- Size and shape: larger, denser beads are easier to capture by settling than low-density fibers and small fragments; the reported “removal” also depends on the counting method and size cutoff.
- Polymer type: PE, PP, PET, PVC and PS differ in density, surface chemistry and hydrophobicity; weathering can add oxygenated groups and biofilm.
- pH: it changes metal hydrolysis, chitosan protonation, polymer charge and the plastic surface. In the cited PAC/PAM study, the best tested point was pH 7, not a universal pH 5–6 rule.
- Water matrix: NOM, salts, hardness, surfactants and real wastewater solids compete for sites and change floc strength. DI water, tap water, simulated wastewater and secondary effluent are not interchangeable.
- Shear and sequence: rapid mixing forms destabilized contacts, slow mixing grows flocs, and excessive shear can break a fragile plastic-containing floc.
Microplastic coagulation workflow
- Sample correctly. Avoid plastic sampling tools where possible, document storage and include normal and upset water.
- Characterize the particles. Report size bands, fibers/fragments/films, polymer type and surface condition using microscopy, FTIR/Raman or another validated method.
- Run a matrix-matched jar screen. Vary PAC/PFS dose, pH, rapid/slow mix, settling time and aid concentration. Include a no-chemical control.
- Test the sequence. Compare PAC alone, PAC + cationic PAM, PAC + chitosan and a PFS comparator. Record polymer make-down, feed point and contact time.
- Verify capture. Measure residual microplastics in the supernatant and filter backwash/sludge with a method that can see the relevant size range and polymer types.
- Confirm operability. Check sludge dewatering, residual Al/Fe/PAM/chitosan, filter loading and the fate of captured particles before scale-up.
Buyer data package for a microplastics program
- Particle count by size, morphology and polymer type; method detection limit and blank-control results.
- pH, conductivity, hardness, alkalinity, turbidity, TSS, DOC/TOC, surfactants, salts and background solids.
- PAC/PFS active basis, basicity, Fe or Al content, pH, density, storage and batch COA.
- PAM ionic character, charge density, molecular-weight range, residual monomer statement, make-down and dosing sequence.
- Chitosan degree of deacetylation, molecular-weight range, acid solvent, solubility, pH window and biodegradability documentation.
- Jar-test mixing energy, contact time, settling/filtration method, sludge volume, dewatering result and acceptance criteria.
Start with the coagulants and flocculants category, compare PAC and PFS product information, then use the jar-test procedure and the inquiry page to frame a matrix-matched trial.
Frequently asked questions
Can coagulation remove microplastics from water?
Yes, coagulation and flocculation can transfer many microplastics into settleable flocs, but efficiency depends on size, shape, polymer, surface weathering, pH, NOM, salts, dose and separation. It is not a universal percentage for all microplastics or all wastewater.
How effective is PAC at removing microplastics?
In one 2026 wastewater study with polystyrene, PAC alone peaked at 33.75 ± 1.77% at pH 7, while a PAC plus cationic PAM system reached 87.5 ± 3.53% under its stated dose and mixing conditions. Those values are study-specific and should be used as a screening benchmark only.
Does cationic PAM improve microplastic removal?
It can. Cationic PAM can add charge patching and polymer bridging after PAC or PFS destabilizes the particles. The order, charge density, molecular weight, dose, shear and residual polymer must be tested because overdosing or excessive shear can weaken the floc or affect downstream treatment.
Is PAC better than PFS for microplastics?
Not universally. Some current comparisons report higher PS removal with PAC, while other water matrices and process conditions favor ferric or PFS. Compare PAC and PFS at the same particle population, pH, active-metal basis, mixing and separation method rather than relying on the acronym.
Can chitosan remove microplastics?
Chitosan can contribute charge neutralization, adsorption and sweep-flocculation assistance, especially when it is soluble and protonated in the selected pH range. A PET study reported close to 90% removal for PAC–chitosan in tap water, but that result does not represent every polymer, particle size or wastewater matrix.
Who prepared this guide
VCYCLETECH Technical Team prepared this guide for buyers comparing coagulation and polymer-assisted separation of microplastic-containing water. Particle size, water matrix, mixing, separator type and the counting method all shape the trial that is worth running.
References
- Sustainability 2026: PAC, PFS and PAM microplastic coagulation study
- Journal of Water Process Engineering: PAC–chitosan and PET study
- Journal of Hazardous Materials: FeCl3–chitosan conditions and PS removal
- Peer-reviewed review: particle, matrix and coagulation mechanism limits
Related: Coagulants and flocculants · PAC product · PAM product · Jar-test procedure