
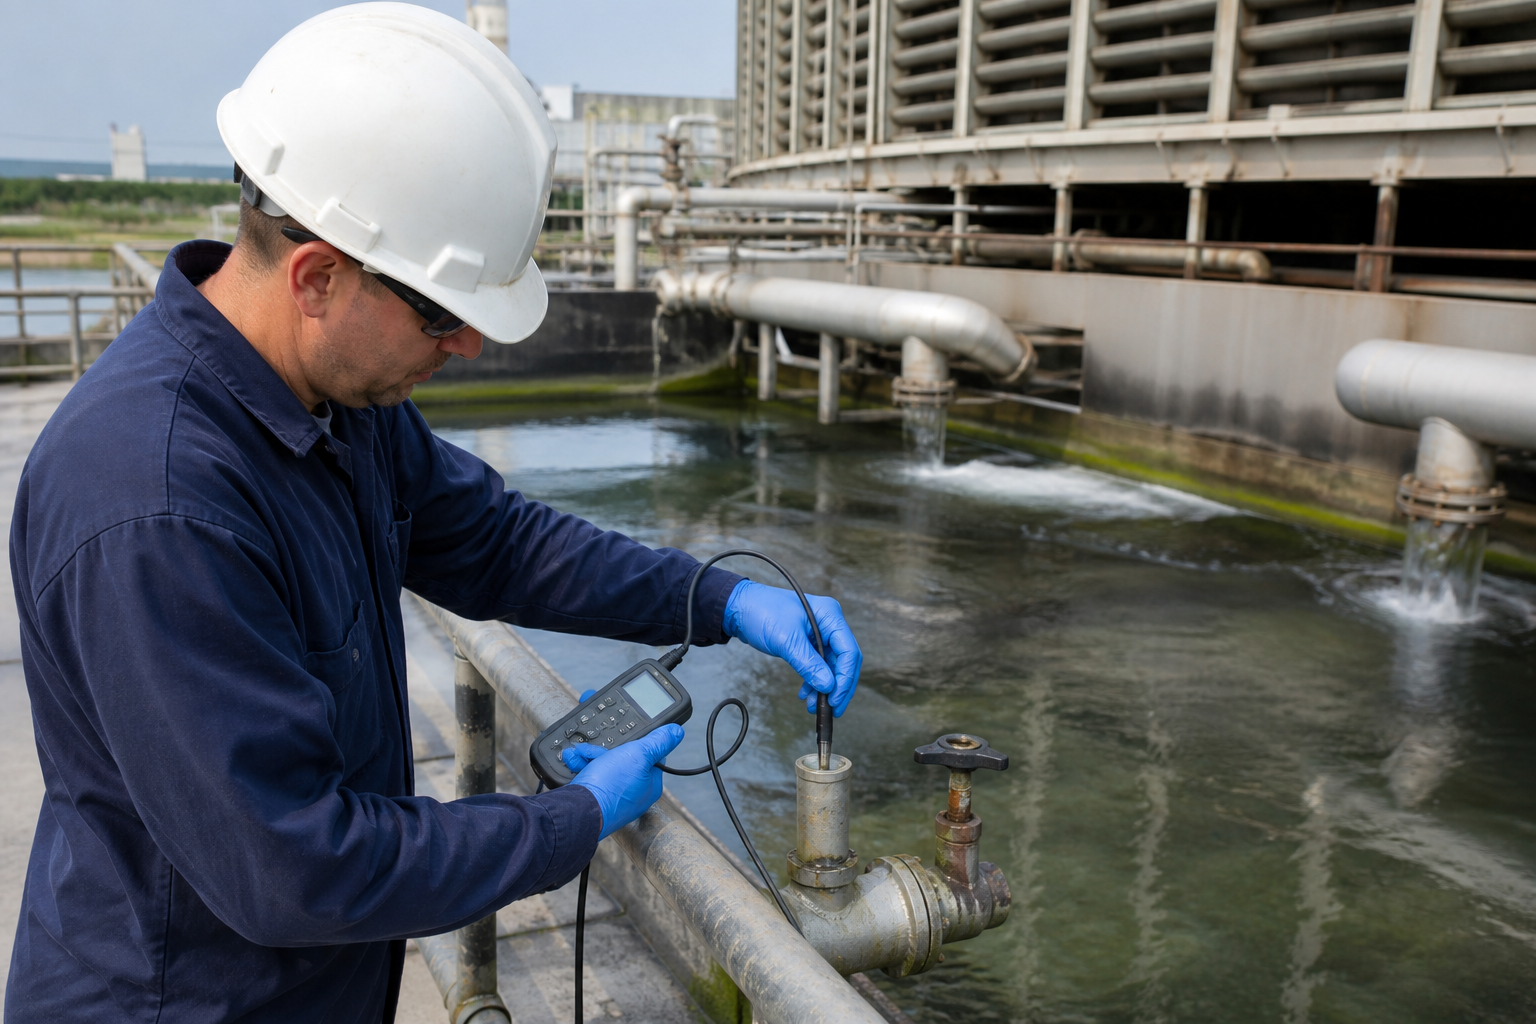
Cooling Tower Chemical Program KPI Dashboard: Cycles, Blowdown & Deposit Signals
TL;DR A useful cooling-tower chemical KPI dashboard links cycles of concentration, conductivity, blowdown, corrosion indicators, deposit observations and microbiological results. No single KPI proves program success. Use trends to identify drift, then confirm the cause with water analysis, coupon data, deposit examination and a review of feed equipment and operating changes.
Which cooling-tower KPIs should be monitored?
Start with KPIs that connect operating water balance to failure modes: makeup, blowdown, conductivity, estimated cycles of concentration, pH/alkalinity/hardness where relevant, inhibitor or biocide test results, corrosion-monitoring evidence, deposits and microbiological data. The correct control ranges and alarm limits are site-specific. They must not be copied from an unrelated supplier sheet, locality or tower.

| KPI or evidence | What a trend can signal | Confirmation step | Boundary |
|---|---|---|---|
| Cycles / conductivity relationship | Excessive or insufficient concentration, controller drift, a changed makeup source or calculation mismatch. | Compare dated makeup and recirculating analyses; inspect probe, setpoint, calibration and water balance. | Conductivity is a proxy for dissolved solids, not a complete scale or corrosion prediction. |
| Blowdown and makeup | Unexpected water loss, stuck valve, altered load, changed drift or leaking equipment. | Check meter data, valve actuation, basin level, operational events and the material balance. | Use actual site meters and account for evaporation and drift; do not infer cause from one reading. |
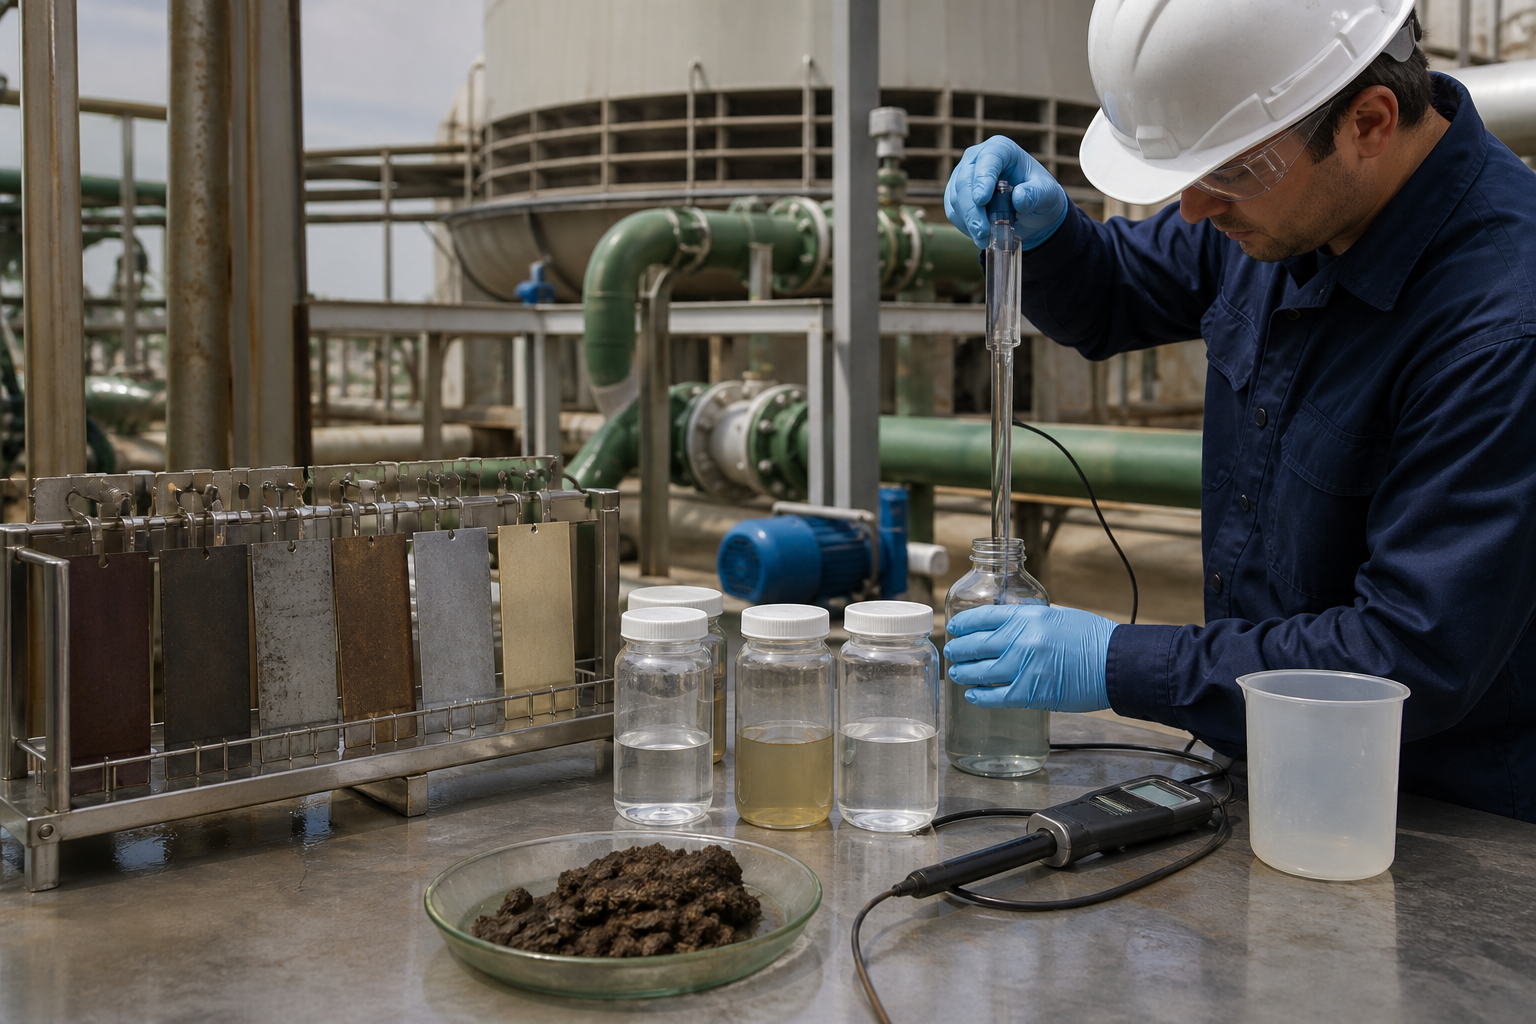
| Corrosion coupon / inspection | Uniform corrosion trend or visible under-deposit / localized attack needing examination. | Verify coupon position, exposure, flow, metallurgy, handling and heat-exchanger inspection history. | One coupon does not prove all locations or fully quantify localized corrosion. |
| Deposit and heat-transfer signals | Scaling, suspended solids, biofilm, dispersancy gap or a changed water chemistry/load. | Photograph and examine deposits; compare water analysis, filtration, feed and exchanger data. | Appearance alone cannot identify mineral, organic or microbiological composition. |
| Microbiology / disinfectant control | Biofilm risk, reduced heat transfer, under-deposit corrosion risk or unstable biocide delivery. | Follow the site water-management plan; check sampling method, recirculation, feed equipment and cleaning history. | Use the applicable program and public-health requirements; not a universal test limit. |
How do cycles and blowdown indicate treatment problems?
DOE defines cycles of concentration as the ratio of dissolved solids in blowdown to makeup water and gives the practical approximation of makeup divided by blowdown under the stated water-balance assumptions. In a simplified tower balance, blowdown ≈ evaporation ÷ (cycles − 1). These are planning and diagnostic relationships—not automatic setpoints. Drift, meter accuracy, uneven loads, changing makeup and non-conservative species can make a simple calculation misleading.
| Observed pattern | Possible failure mode | What not to assume | Next evidence |
|---|---|---|---|
| Conductivity rises faster than expected | Blowdown/control problem, changed makeup, load change or concentration of water constituents. | Do not assume scaling without water chemistry and deposit evidence. | Probe check, meter trend, makeup/circulating analysis and valve inspection. |
| Cycles fall while makeup rises | Excess blowdown, controller/valve issue, leak or operating change. | Do not call it a chemical failure before checking water balance and equipment. | Blowdown flow, valve actuation, makeup meter, basin/drift and operating log. |
| Coupon trend worsens with deposits | Under-deposit attack, incompatible conditions, microbiological contribution or monitoring error. | Do not report a global corrosion rate from one position. | Coupon installation record, deposit examination, microbiology and heat-exchanger inspection. |
| Residual / feed signal becomes erratic | Feed-pump, injection, dilution, inventory, hold-time or testing issue. | Do not increase feed blindly or treat a test as the sole cause. | Calibrate test, check pump stroke/flow, tank level, injection point and timing. |
A KPI-to-failure-mode dashboard, not a single score
A practical dashboard groups measurements into three questions: is the water balance stable? is the protective program reaching the system? and is equipment evidence improving or deteriorating? ASHRAE notes that buildup of scale, corrosion products and sediment can reduce biocide effectiveness, and the CDC advises monitoring inhibitor levels as indicated by water-quality measurements, with controls and frequency adapted to the site program.
Cooling-tower KPI escalation workflow
- Record context with the number. Include sampling point, method, units, time, tower cell/load, makeup source, weather/seasonal change and known operational events.
- Validate the measurement chain. Check analyzer calibration, sample handling, test expiry, meter alignment and controller operation before changing feed.
- Reconcile water balance. Compare makeup, blowdown, conductivity and calculated cycles; investigate differences rather than forcing the calculation to fit.
- Look for physical evidence. Review coupons, strainers, basin condition, deposit photographs, exchanger inspection and filtration observations.
- Bound the corrective action. Define the changed variable, expected response, time window, safety/discharge constraints and the evidence that would trigger escalation.
What proves a cooling-water program is working?
Working does not mean a dashboard is green. It means the water balance, chemical monitoring, corrosion/deposit evidence and microbiological controls are stable enough for the site’s documented operating envelope, and deviations are investigated with traceable evidence. CDC notes that scale, corrosion, sediment controls and system cleaning are part of cooling-tower operations and Legionella prevention; this is why treatment, maintenance and water-management responsibilities should be visible together.
Use the cooling-water treatment application page to frame the system, then map the purchase discussion to corrosion inhibitors, polycarboxylic antiscalant and dispersant options, and biocide and algicide solutions. Related diagnostics include converting a cooling tower to non-phosphorus treatment, reclaimed water as cooling makeup, and open vs closed loop inhibitor selection. Send a dated KPI export, water analyses and equipment observations through the technical inquiry page for a bounded discussion—not a generic alarm-limit promise.
Frequently asked questions
Which cooling-tower KPIs should be monitored?
Track water-balance and chemistry trends together: makeup, blowdown, conductivity, estimated cycles, relevant pH/alkalinity/hardness, treatment residuals, corrosion evidence, deposits and microbiological indicators. The target ranges and frequencies must be based on the specific water, materials, equipment and water-management program.
How do cycles and blowdown indicate treatment problems?
Compare makeup, blowdown, conductivity and calculated cycles over time. A divergence can signal excess or insufficient blowdown, changed makeup, controller drift, leakage, load change or an instrument issue. Confirm the cause with meters, samples, valve inspection and operating context before changing treatment.
What proves a cooling-water program is working?
A working program shows stable, traceable water balance and chemical delivery plus acceptable site-specific corrosion, deposit and microbiological evidence. It also has a documented response when a trend changes. A single residual, conductivity reading or coupon cannot prove total program success.
Is conductivity a universal cooling-tower alarm limit?
No. Conductivity is commonly used as a proxy for dissolved solids and to control blowdown, but a universal limit would ignore makeup water, cycles, metallurgy, scaling tendency, local discharge rules, controller method and site operating conditions.
How often should cooling-tower water be tested?
Set frequency in the site water-management program and adjust it to system stability, operating changes and risk. CDC advises regular monitoring and increasing measurement frequency when control indicators are variable. Follow applicable public-health, manufacturer and local requirements.
About the author and evidence
To narrow the available grades, share the industry, water or process conditions, treatment objective, current program, required quantity, packaging and destination. Representative sample results are helpful when performance depends on site water chemistry.
References
- U.S. DOE: Cooling Tower Management best-management practice
- U.S. DOE: cooling-tower water balance and cycle equations
- ASHRAE Handbook: cooling-water monitoring, coupons and biological control
- CDC: controlling Legionella in cooling towers (updated 2025)
Related: Cooling-water treatment · Corrosion inhibitors · Technical inquiry